bdvis: biodiversity data visualizations
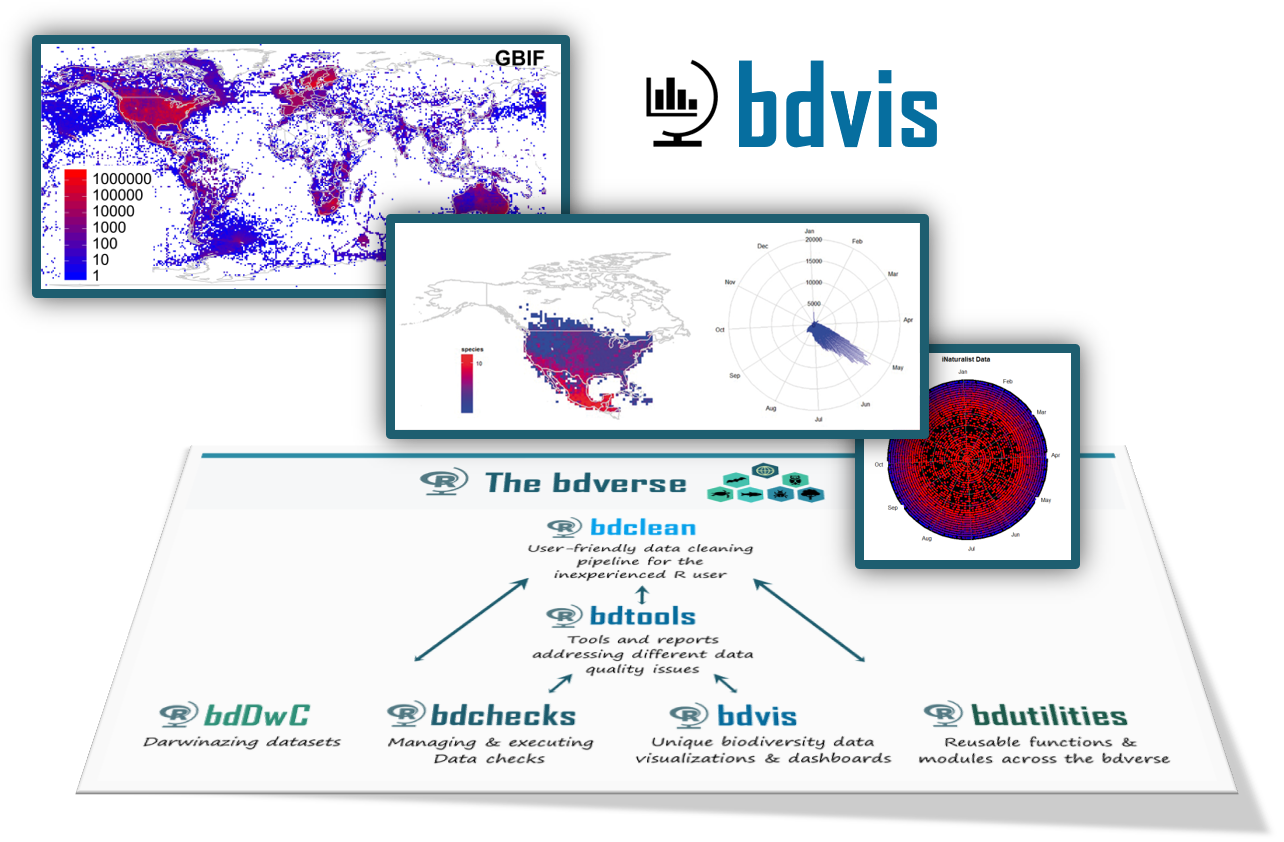
bdvis generates informative visualizations of your data with ease. It is a R package which helps to understand completeness of biodiversity inventory, extent of geographical, taxonomic and temporal coverage, gaps and biases in data. The package was inspired by the BIDDSAT described in Otegui and Ariño, 2012. BIDDSAT is static and cannot be run with custom data, and the package bdvis was developed in order to fill this gap. Description of the package is available in Barve & Otegui, 2016.
Architecture overview
[TBA]
Major challenges ahead
- Developing a versatile sent of visualizations to highlight spatial, temporal and taxonomic dimentions of biodiversity occurrence data
Future plans
- Enhance the UI using shiny and dashboards.
- Develop more visualizations to explore data.
- Closer integration with other
bdversepackages

